
🌿 4/20/2026 MOCann Brief
Missouri's cannabis consumers made their presence felt this holiday, as the state posted its biggest 4/20 yet — and the data shows the celebration is only getting sharper.
Missouri's legal cannabis market delivered a standout performance on April 20, 2026, generating $6.87 million in single-day sales across more than 284,000 units, good enough for sixth place among all tracked U.S. markets on the cannabis industry's biggest sales day of the year, according to data from Headset.
The result marked a 23.5% jump in sales and a 32.5% surge in units compared to the same day in 2025, outpacing a nearly flat broader week and signaling that Missouri consumers are increasingly concentrating their spending on the holiday itself rather than the days surrounding it. With a 30.4% discount rate driving heavy promotional activity and local brands like Illicit Gardens, Vibe Cannabis, and Sinse dominating the leaderboard, the Show-Me State is cementing its status as one of the Midwest's most dynamic cannabis markets.
 Dicover even more data from headset here: https://420.headset.io/
🌿 4/20/2026 MOCann Brief - Presented by Headset
All figures are in USD
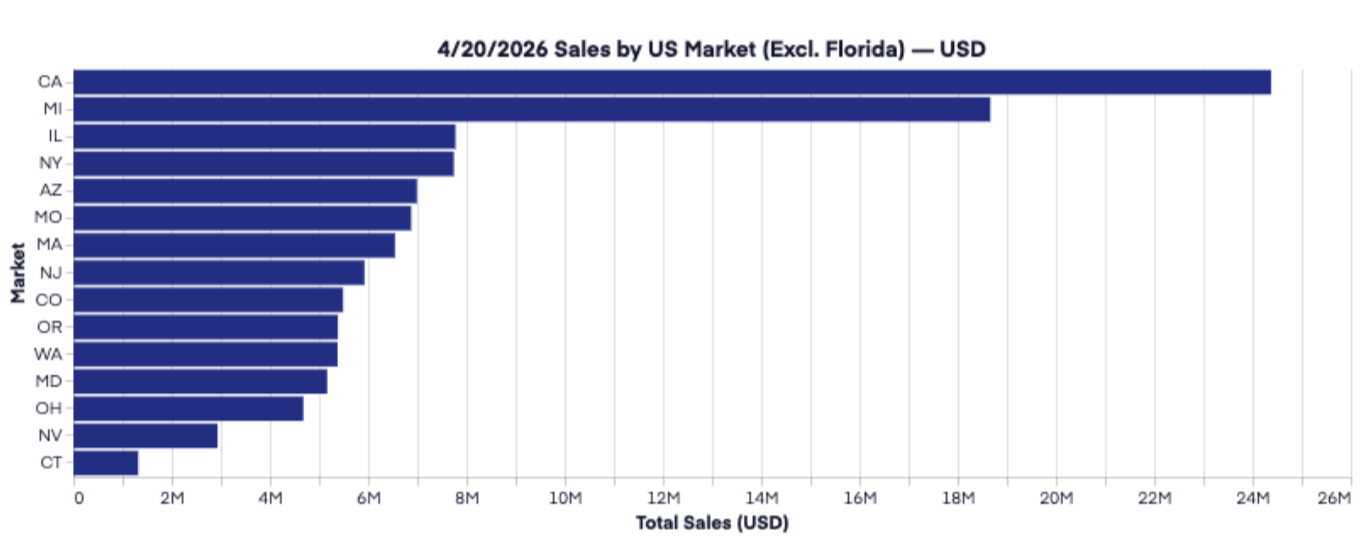
1. National 4/20/2026 Sales & Units by Market
| Market | Total Sales (USD) | Total Units |
|---|---|---|
| CA | $24,380,781 | 1,537,180 |
| MI | $18,664,213 | 2,402,071 |
| IL | $7,777,197 | 342,197 |
| NY | $7,743,920 | 290,343 |
| AZ | $6,992,080 | 452,478 |
| MO | $6,875,786 | 284,409 |
| MA | $6,546,135 | 468,725 |
| NJ | $5,924,813 | 227,210 |
| CO | $5,489,690 | 435,447 |
| OR | $5,383,079 | 545,286 |
| WA | $5,377,564 | 512,396 |
| MD | $5,165,551 | 226,046 |
| OH | $4,680,197 | 171,889 |
| NV | $2,934,247 | 193,676 |
| CT | $1,318,791 | 54,196 |
Missouri ranked 6th nationally on 4/20/2026, generating nearly $6.88M in sales across 284K+ units. The total national 4/20 haul was approximately $126.3M USD.
2. Missouri 4/20/2026 Deep Dive
📊 Overall Market Snapshot
| Metric | Value |
|---|---|
| Total Sales | $6,875,786 |
| Total Units | 284,409 |
| Total Discounts | $2,999,416 |
| Discount Rate | 30.4% |
Missouri retailers were heavily promoting for 4/20 with a 30.4% discount rate — nearly a third of gross revenue was discounted, indicating strong promotional activity across the market.
🏆 Top 15 Brands in MO on 4/20/2026
| Rank | Brand | Sales (USD) | Units |
|---|---|---|---|
| 1 | Illicit / Illicit Gardens | $528,310 | 17,458 |
| 2 | Vibe Cannabis (MO) | $419,175 | 15,916 |
| 3 | Sinse Cannabis | $397,300 | 21,260 |
| 4 | Flora Farms | $340,201 | 11,096 |
| 5 | Good Day Farm | $310,270 | 13,984 |
| 6 | CODES | $244,149 | 10,778 |
| 7 | Vivid (MO) | $204,474 | 9,166 |
| 8 | Proper Cannabis | $162,751 | 8,209 |
| 9 | Curio Wellness | $160,993 | 7,109 |
| 10 | Rove | $153,639 | 3,948 |
| 11 | Elevate | $152,843 | 4,852 |
| 12 | Galactic | $136,841 | 5,080 |
| 13 | Amaze Cannabis | $134,829 | 6,940 |
| 14 | Jeeter | $128,979 | 5,012 |
| 15 | Robust | $125,534 | 6,513 |
Illicit / Illicit Gardens dominated 4/20 in Missouri, followed by Vibe Cannabis (MO) and Sinse Cannabis. Notable that Sinse led in unit volume (21,260 units) despite being 3rd in dollar sales, suggesting a lower average item price / value-oriented positioning.
📦 Top Categories in MO on 4/20/2026
| Category | Sales (USD) | Units | Discounts | Discount Rate |
|---|---|---|---|---|
| Flower | $2,849,869 | 92,474 | $1,366,181 | 32.4% |
| Vapor Pens | $1,558,291 | 46,801 | $636,884 | 29.0% |
| Pre-Roll | $1,070,873 | 80,070 | $424,549 | 28.4% |
| Edible | $943,993 | 48,006 | $363,505 | 27.8% |
| Concentrates | $352,640 | 10,789 | $172,831 | 32.9% |
| Beverage | $55,887 | 4,686 | $20,782 | 27.1% |
| Topical | $19,860 | 640 | $6,620 | 25.0% |
| Capsules | $13,091 | 482 | $4,287 | 24.7% |
| Tincture & Sublingual | $11,282 | 461 | $3,778 | 25.1% |
Flower was king on 4/20, commanding 41.5% of all MO sales that day. Concentrates had the highest discount rate at 32.9%, closely followed by Flower at 32.4%, suggesting these inhalable categories saw the most aggressive promotions.
3. Missouri 4/20 Period Comparison — 2026 vs. 2025 Benchmark (7-Day Window)
Now comparing the identical date range (April 14–20) for both years:
7-Day Lead-Up (4/14–4/20) & 4/20 Day
| Period | Sales (USD) | Units |
|---|---|---|
| 2026: Week (4/14–4/20) | $34,373,238 | 1,326,488 |
| 2025: Week (4/14–4/20) | $34,111,405 | 1,229,181 |
| Week YoY Change | +0.8% | +7.9% |
| 2026: 4/20 Day Only | $6,875,786 | 284,409 |
| 2025: 4/20 Day Only | $5,566,497 | 214,675 |
| 4/20 Day YoY Change | +23.5% | +32.5% |
4/20 as a Share of the Full Week
| Year | 4/20 Sales as % of Week | 4/20 Units as % of Week |
|---|---|---|
| 2026 | 20.0% | 21.4% |
| 2025 | 16.3% | 17.5% |
Key Insight
When looking at the same 7-day window, overall weekly sales were relatively flat year-over-year (+0.8%), meaning the market itself wasn't dramatically larger during the lead-up. However, the 4/20 day itself surged +23.5% in sales and +32.5% in units — indicating that in 2026, consumer spending was more heavily concentrated on the actual holiday versus being spread across the surrounding days. The 4/20 day represented 20% of the week's sales in 2026 vs. only 16.3% in 2025, showing the holiday is becoming a sharper, more defined peak event in Missouri.
Year-over-Year: 4/20/2026 vs. 4/20/2025
| Metric | 4/20/2025 | 4/20/2026 | YoY Change |
|---|---|---|---|
| Sales | $5,566,497 | $6,875,786 | +23.5% |
| Units | 214,675 | 284,409 | +32.5% |
Key Takeaways for the Partnership
-
Missouri is a top-tier 4/20 market — ranked 6th nationally with nearly $6.9M in single-day sales, demonstrating strong consumer engagement.
-
4/20/2026 was the biggest sales day of the week despite falling on a Monday, proving the holiday's pull power transcends the day of the week. Sales were ~98% higher than the Tuesday baseline at the start of the week.
-
Massive YoY growth — Missouri 4/20 sales grew +23.5% year-over-year (and units grew +32.5%), showing an accelerating market with expanding consumer base.
-
Heavy promotional environment — A 30.4% discount rate means retailers and brands are investing heavily in 4/20 deals. Any partnership should account for this promotional intensity.
-
Local brands dominate — The top 5 brands are all Missouri-rooted operators (Illicit, Vibe, Sinse, Flora Farms, Good Day Farm), though national brands like Rove and Jeeter are making inroads.
-
Flower is the anchor category at 41.5% of sales, but Pre-Roll leads in unit volume per dollar, making it an ideal category for trial-driving promotions.
Headset, is the #1data platform for the cannabis economy.
With a deep understanding of the market and a commitment to data-driven insights, we empower businesses to make informed decisions and drive growth in this rapidly evolving sector.
As the cannabis industry continues to expand and mature, Headset harnesses the power of data to provide valuable intelligence and actionable analytics to businesses operating within the space. Our comprehensive suite of analytical tools and services enables cannabis retailers, brands, and industry stakeholders to gain a competitive edge, optimize operations, and maximize profitability.
By leveraging our robust data platform, businesses can access real-time market trends, consumer insights, and sales analytics to drive strategic decision-making. Whether it's understanding product performance, identifying emerging market opportunities, or tracking consumer preferences, Headset equips clients with the knowledge needed to navigate the complex and dynamic cannabis landscape.